Copyright © 2023 ESCI, LLC - All Rights Reserved.

SEVIEW
Transport and fate modeling software
SESOIL
Reports
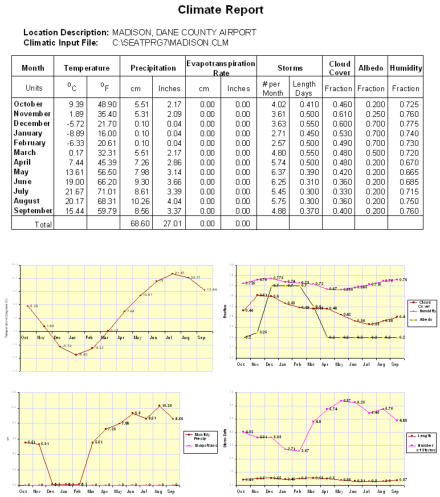
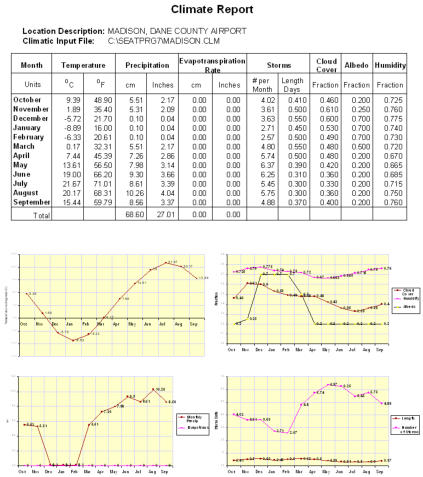
Climate Report
The SESOIL climate report displays the
climatic input parameters.
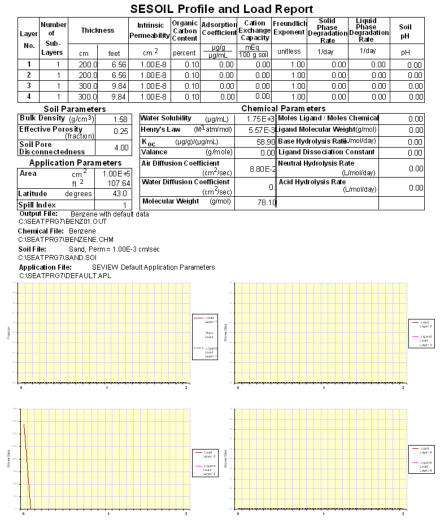
Profile and Load Report
The SESOIL Profile and Load Report
displays information on the soil profile
and contaminant load model input
parameters.
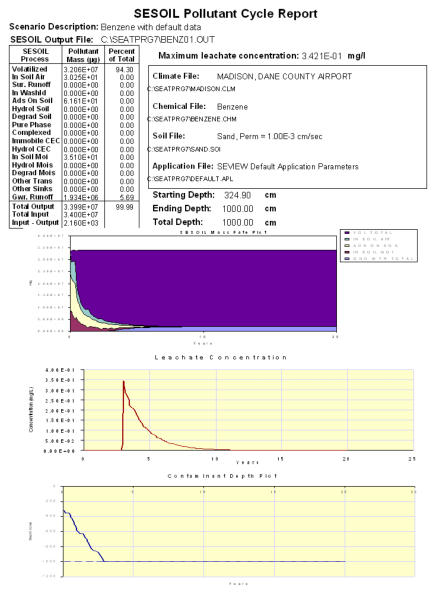
Pollutant Cycle Report
This report displays the results of the
SESOIL Pollutant Cycle sub-model.
Model results are presented as graphical
plots and summary tables. The first
graph from the top is the mass fate plot.
It displays the monthly distribution of
the contaminant in the SESOIL soil
column over time. The leachate
concentration plot is located below the
mass fate plot. The leachate plot
displays the monthly concentration of
the contaminant leaving the bottom of
the soil column. In addition, the
maximum SESOIL leachate
concentration value is presented just
below the leachate concentration plot.
The contaminant migration plot displays
the starting and ending depths, along
with the depth to the water table. A
description of the SESOIL input files
used is presented above the
contaminant depth plot. The upper left
of the report contains a table that
summarizes the mass in each of the
SESOIL processes.
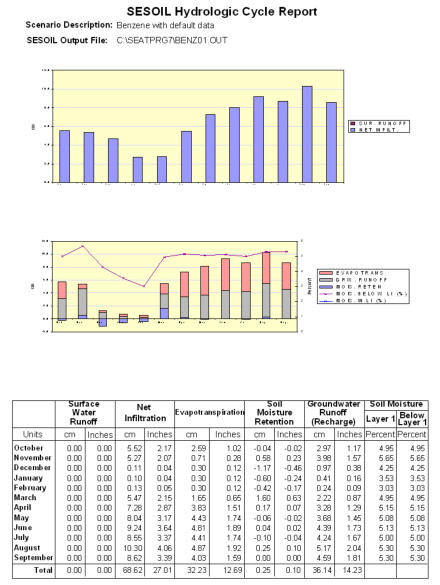
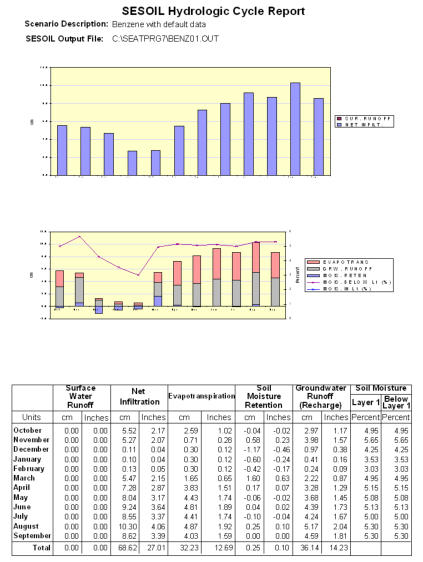
Hydrologic Cycle
Report
This report displays the results of the
SESOIL Hydrologic Cycle sub-model
including: surface water runoff,
infiltration, evapotranspiration,
moisture retention, soil moisture
content, and groundwater recharge.
Data Extraction Tools
Although the SEVIEW program produces several built-in reports, it is impossible to anticipate all potential uses
of the model results. SEVIEW includes tools that provide access to all SESOIL and AT123D input and output data.
These tools can be used to extract specific data or to present the report data in different ways. Graphs and data
produced by SEVIEW can be transferred to word processors, spreadsheets, and presentation software.


SEVIEW
Transport and fate modeling software
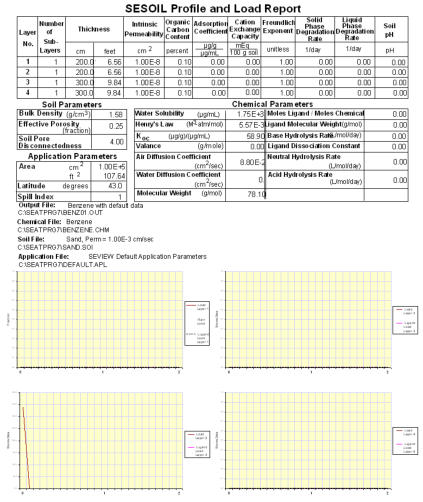

Profile and Load Report
The SESOIL Profile and Load Report displays
information on the soil profile and contaminant
load model input parameters.
SESOIL Reports
Climate Report
The SESOIL climate report displays the climatic input
parameters.
Hydrologic Cycle Report
This report displays the results of the SESOIL
Hydrologic Cycle sub-model including: surface
water runoff, infiltration, evapotranspiration,
moisture retention, soil moisture content, and
groundwater recharge.
Pollutant Cycle Report
This report displays the results of the SESOIL
Pollutant Cycle sub-model. Model results are
presented as graphical plots and summary tables.
The first graph from the top is the mass fate plot.
It displays the monthly distribution of the
contaminant in the SESOIL soil column over time.
The leachate concentration plot is located below
the mass fate plot. The leachate plot displays the
monthly concentration of the contaminant
leaving the bottom of the soil column. In addition,
the maximum SESOIL leachate concentration
value is presented just below the leachate
concentration plot. The contaminant migration
plot displays the starting and ending depths,
along with the depth to the water table. A
description of the SESOIL input files used is
presented above the contaminant depth plot. The
upper left of the report contains a table that
summarizes the mass in each of the SESOIL
processes.
Data Extraction Tools
Although the SEVIEW program produces several
built-in reports, it is impossible to anticipate all
potential uses of the model results. SEVIEW
includes tools that provide access to all SESOIL
and AT123D input and output data. These tools
can be used to extract specific data or to present
the report data in different ways. Graphs and
data produced by SEVIEW can be transferred to
word processors, spreadsheets, and
presentation software.