Copyright © 2023 ESCI, LLC - All Rights Reserved.
SESOIL Climate Input Parameters
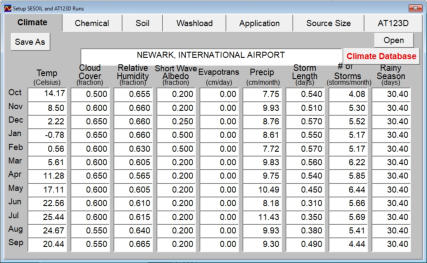
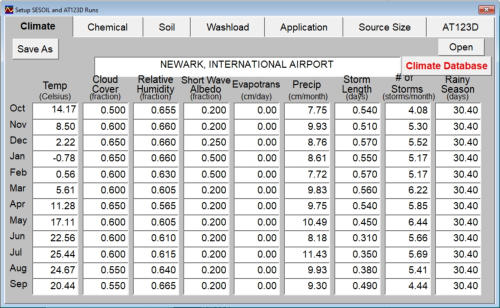
SESOIL is a seasonal vadose zone model. The ability to simulate seasonal variations is one of the principle reasons it has been used by consultants, regulators, and universities around the world. The seasonal input parameters are contained in the climatic input file. The climatic data consists of information on monthly air temperature, cloud cover, relative humidity, short wave Albedo, and rainfall. The rainfall data consists of precipitation amounts, storm length, number of storms, and the distribution of precipitation throughout the month. The climatic data is primarily used by the SESOIL hydrologic cycle sub-model. The hydrologic cycle predicts distribution of precipitation between surface water runoff, infiltration, evapotranspiration, soil moisture retention, and groundwater recharge. Monthly variations in climatic parameters can have a significant influence on the hydrologic cycle, which in turn has a strong influence on the fate of the contaminants. This influence is so strong that for the most part calibration of SESOIL consists of evaluating the results of the hydrologic cycle. Thanks to the 22,355 location climatic database in SEVIEW all you need to do is find the closest weather station to your site. If your site is not in the United States, with the exception of the number and length of storm events most of the data can be found on the internet. A detailed description of each input parameter is provided below. Additional information can be found in the SEVIEW User's Guide and the help file. Precipitation Data The rainfall data consists of precipitation amounts, storm length, number of storms, and the distribution of precipitation throughout the month. Use of the storm data means that sites with identical amounts of precipitation may not have identical rates of groundwater recharge. Precipitation This is simply the 30 year mean monthly rainfall amounts in centimeters. Please note that SESOIL does not specifically account for frozen soil or snow fall. All precipitation is assumed to be in the form of rain. As evapotranspiration rates are lower in the winter the precipitation will produce high rates of groundwater recharge, when in fact the snow never even entered the soil! To account for frozen soil I reduce precipitation to 0.10 cm for any month in which the average temperature is below 0oC. With one exception, if the average temperature is just below freezing for the first month of the winter season, I assume the soil has not yet frozen. It has been suggested that the accumulated snow melt must be accounted for in the spring. However, it appears to me that both the snow and soil beneath melt from the top down. As such, most of the snow is lost to sublimation and surface water runoff before the soil even melts. Number of Storm Events The number of storm events specifies how often rains in a given month. Monthly precipitation is divided by the number of storms. This can be important as the larger the number of storms, the smaller the precipitation in each storm, and thus the higher the infiltration. The inverse is also true, fewer storms will result in higher amounts of surface water runoff and thus lower rates of infiltration. Duration of Storm Events The storm duration data specifies how long each storm event lasts in days. For example, a value of 0.5 means that it will rain for 12 hours. The shorter the rain events, the stronger the downpour which produces higher rates of surface water runoff. As with other climatic data, the storm length can change significantly from month to month. Although not typically reported, you may have an intuitive feel for this data. For instance, here in Wisconsin in the summer we typically get short strong downpours during otherwise hot sunny days. While in the fall we generally have cool cloudy days where it often rains gently most of the day. Using this approach, you can approximate storm event data for any location around the world. Sensitivity analysis could then be performed to determine how SESOIL responds to these parameters at your site. Length of the Rainy Season The length of the rainy season specifies the length in days over which the precipitation can occur. It is usually set to 30.4 days (one month). A value of 30.4 means that it can rain every day of the month. Entering a smaller value like 7.0 for example, would compress precipitation to the first week of the month. Soil Temperature Parameters Soil temperature in SESOIL is controlled by air temperature, site latitude, time of year, cloud cover, and surface Albedo. Soil temperature is then used along with several other factors to estimate evapotranspiration and volatilization. Basically, the colder the soil is the lower evapotranspiration will be which will result in higher groundwater recharge rates. Air Temperature This data consists of 30 year monthly mean air temperatures in degrees Celsius. Site Latitude Although the site latitude is located in the SESOIL application file, I consider it part of the climatic parameters. Latitude is used to establish the intensity of the sunshine along with seasonal variations. Cloud Cover SESOIL uses the fraction of cloud cover to reduce the effectiveness of heating produced by the sun. Short Wave Albedo The short wave Albedo is the ratio of the reflective energy to the incoming sunlight. It is basically controlled by the color of the surface material. For instance, fresh white snow has a very high Albedo, while black asphalt has a very low Albedo. The lower the Albedo the more energy is adsorbed by the soil and thus the higher the soil temperature. The default data included in the SEVIEW climatic database may need to be replaced depending on the specific surface materials at your site. You can find Albedo values for a wide range of surface materials in the SEVIEW User’s Guide and help file. Evapotranspiration Data Soil temperature and relative humidity are used by SESOIL to estimate monthly evapotranspiration rates. Relative Humidity Relative humidity is the fraction of water in the air compared with the maximum amount of water the air can hold at that temperature. Evapotranspiration Rate If a zero is entered, the SESOIL hydrologic cycle will calculate evapotranspiration. However, if a positive non-zero value is entered, SESOIL turns off the hydrologic cycle. Groundwater recharge is then set to the difference between precipitation and evapotranspiration. Please note that the units are in centimeters per day not centimeters per month.
SEVIEW
Transport and fate modeling software


SESOIL Climate Input
Parameters
SESOIL is a seasonal vadose zone model. The ability to simulate seasonal variations is one of the principle reasons it has been used by consultants, regulators, and universities around the world. The seasonal input parameters are contained in the climatic input file. The climatic data consists of information on monthly air temperature, cloud cover, relative humidity, short wave Albedo, and rainfall. The rainfall data consists of precipitation amounts, storm length, number of storms, and the distribution of precipitation throughout the month. The climatic data is primarily used by the SESOIL hydrologic cycle sub-model. The hydrologic cycle predicts distribution of precipitation between surface water runoff, infiltration, evapotranspiration, soil moisture retention, and groundwater recharge. Monthly variations in climatic parameters can have a significant influence on the hydrologic cycle, which in turn has a strong influence on the fate of the contaminants. This influence is so strong that for the most part calibration of SESOIL consists of evaluating the results of the hydrologic cycle. Thanks to the 22,355 location climatic database in SEVIEW all you need to do is find the closest weather station to your site. If your site is not in the United States, with the exception of the number and length of storm events most of the data can be found on the internet. A detailed description of each input parameter is provided below. Additional information can be found in the SEVIEW User's Guide and the help file. Precipitation Data The rainfall data consists of precipitation amounts, storm length, number of storms, and the distribution of precipitation throughout the month. Use of the storm data means that sites with identical amounts of precipitation may not have identical rates of groundwater recharge. Precipitation This is simply the 30 year mean monthly rainfall amounts in centimeters. Please note that SESOIL does not specifically account for frozen soil or snow fall. All precipitation is assumed to be in the form of rain. As evapotranspiration rates are lower in the winter the precipitation will produce high rates of groundwater recharge, when in fact the snow never even entered the soil! To account for frozen soil I reduce precipitation to 0.10 cm for any month in which the average temperature is below 0oC. With one exception, if the average temperature is just below freezing for the first month of the winter season, I assume the soil has not yet frozen. It has been suggested that the accumulated snow melt must be accounted for in the spring. However, it appears to me that both the snow and soil beneath melt from the top down. As such, most of the snow is lost to sublimation and surface water runoff before the soil even melts. Number of Storm Events The number of storm events specifies how often rains in a given month. Monthly precipitation is divided by the number of storms. This can be important as the larger the number of storms, the smaller the precipitation in each storm, and thus the higher the infiltration. The inverse is also true, fewer storms will result in higher amounts of surface water runoff and thus lower rates of infiltration. Duration of Storm Events The storm duration data specifies how long each storm event lasts in days. For example, a value of 0.5 means that it will rain for 12 hours. The shorter the rain events, the stronger the downpour which produces higher rates of surface water runoff. As with other climatic data, the storm length can change significantly from month to month. Although not typically reported, you may have an intuitive feel for this data. For instance, here in Wisconsin in the summer we typically get short strong downpours during otherwise hot sunny days. While in the fall we generally have cool cloudy days where it often rains gently most of the day. Using this approach, you can approximate storm event data for any location around the world. Sensitivity analysis could then be performed to determine how SESOIL responds to these parameters at your site. Length of the Rainy Season The length of the rainy season specifies the length in days over which the precipitation can occur. It is usually set to 30.4 days (one month). A value of 30.4 means that it can rain every day of the month. Entering a smaller value like 7.0 for example, would compress precipitation to the first week of the month. Soil Temperature Parameters Soil temperature in SESOIL is controlled by air temperature, site latitude, time of year, cloud cover, and surface Albedo. Soil temperature is then used along with several other factors to estimate evapotranspiration and volatilization. Basically, the colder the soil is the lower evapotranspiration will be which will result in higher groundwater recharge rates. Air Temperature This data consists of 30 year monthly mean air temperatures in degrees Celsius. Site Latitude Although the site latitude is located in the SESOIL application file, I consider it part of the climatic parameters. Latitude is used to establish the intensity of the sunshine along with seasonal variations. Cloud Cover SESOIL uses the fraction of cloud cover to reduce the effectiveness of heating produced by the sun. Short Wave Albedo The short wave Albedo is the ratio of the reflective energy to the incoming sunlight. It is basically controlled by the color of the surface material. For instance, fresh white snow has a very high Albedo, while black asphalt has a very low Albedo. The lower the Albedo the more energy is adsorbed by the soil and thus the higher the soil temperature. The default data included in the SEVIEW climatic database may need to be replaced depending on the specific surface materials at your site. You can find Albedo values for a wide range of surface materials in the SEVIEW User’s Guide and help file. Evapotranspiration Data Soil temperature and relative humidity are used by SESOIL to estimate monthly evapotranspiration rates. Relative Humidity Relative humidity is the fraction of water in the air compared with the maximum amount of water the air can hold at that temperature. Evapotranspiration Rate If a zero is entered, the SESOIL hydrologic cycle will calculate evapotranspiration. However, if a positive non-zero value is entered, SESOIL turns off the hydrologic cycle. Groundwater recharge is then set to the difference between precipitation and evapotranspiration. Please note that the units are in centimeters per day not centimeters per month.
SEVIEW
Transport and fate modeling software