Copyright © 2023 ESCI, LLC - All Rights Reserved.
AT123D vs. BIOSCREEN
This is a comparison between the AT123D and BIOSCREEN analytical groundwater models. Rather than simply providing a technical description of the models this review looks at variations in model output for comparable input parameters. Unlike numerical models, results in analytical models are calculated independently at each point. This means that users do not need to design a network of grid nodes prior to modeling. In addition, calibration is significantly easier. This ease of use does not necessarily mean the results are any less accurate. In fact, the results can be just as valid for certain conditions. Obviously, this is not to say that all analytical models are equal. As with numerical models there can be significant differences as to which processes are simulated and how the processes are simulated. Both of these models are available as public domain versions and have been incorporated in integrated software packages.AT123D
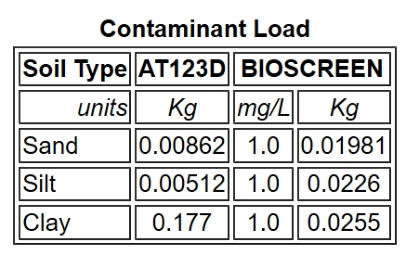
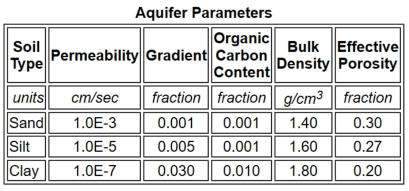
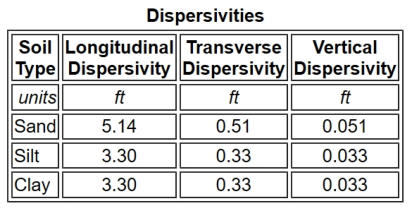
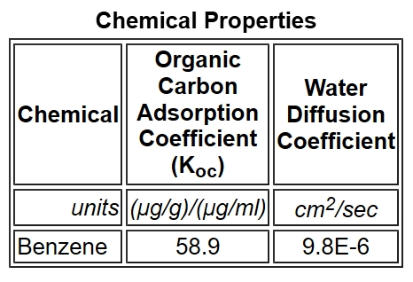
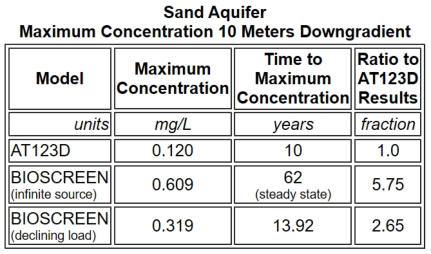
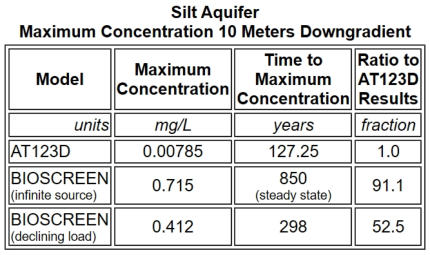
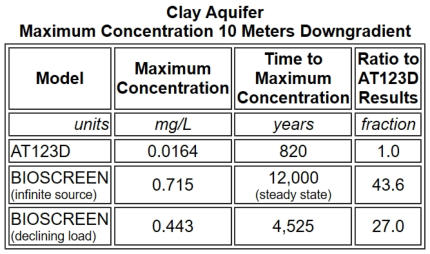
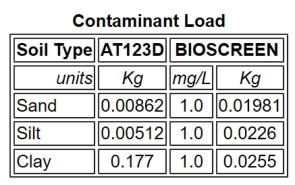
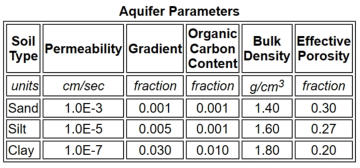
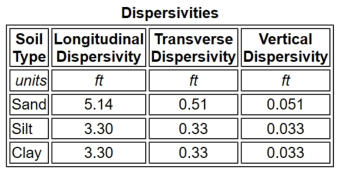
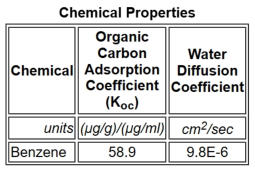
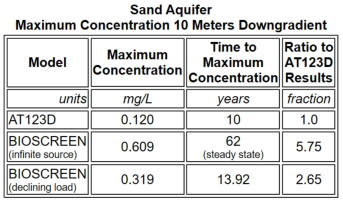
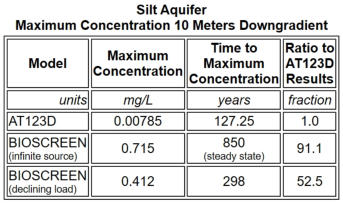
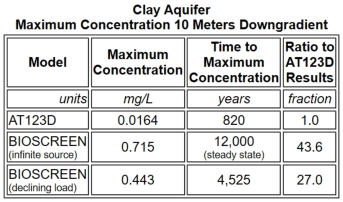
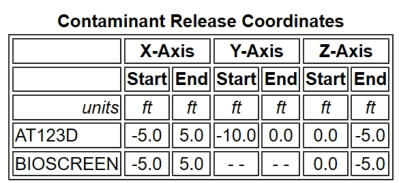
AT123D is a three-dimensional analytical groundwater transport and fate model. Processes simulated include: advection, dispersion, diffusion, adsorption, and biological decay. AT123D was developed in FORTRAN by G. T. Yeh (1981) at Oak Ridge National Laboratory. The version of AT123D in SEVIEW was enhanced to simulate 999 years. Contaminant releases can be simulated as instantaneous, continuous, or varying loads. The ability to utilize varying loads allows it to be linked to the SESOIL vadose zone model. Source load configurations can be established as a point, line, plane, or volume release. AT123D has been used by numerous regulatory agencies to establish baseline cleanup objectives. Cleanup objectives for other regulatory agencies or for site-specific conditions can be calculated by varying the input parameters. BIOSCREEN BIOSCREEN is a two-dimensional screening level groundwater transport and fate model. It was developed in 1996 under contract from the US Air Force, by Ground Water Services, Inc. Unlike most other models, BIOSCREEN is not a standalone program in that it requires Microsoft Excel to run. Transport and fate processes simulated include: advection, dispersion, adsorption, and biological decay. The source is defined as a plane perpendicular to groundwater flow. BIOSCREEN is based on the Domenico model which assumes the source concentration remains constant through time. The developers of BIOSCREEN determined this to be overly conservative and added a declining source term. This declining source should not be confused with biodegradation. Instead, the declining source concentration is designed to simulate the flushing of contamination from the source via groundwater flow. This declining source should be used cautiously. Even the BIOSCREEN documentation states: "this is an experimental relationship, and it should be applied with caution." Model Parameters Input parameters were based on the release of benzene in three aquifer types: sand, silt, and clay. A volume of contaminated groundwater was established. This volume was used to define the release coordinates in AT123D. As BIOSCREEN cannot simulate a volume release, the source was simulated as a plane along the x and y axis. However, the volume of the source was used to calculate the total mass used in the BIOSCREEN declining source term. BIOSCREEN modeling was performed using both an infinite release and a declining source term. A concentration of 1.0 mg/L was established in both models. Mass load to AT123D was calibrated to achieve an initial concentration of 1.0 mg/L in the volume of contaminated groundwater. Additional BIOSCREEN runs were performed using the AT123D mass load for the declining source term. Aquifer Parameters Aquifer parameters were based on three soil types: sand, silt, and clay. Parameters for these soil types were based on information provided in the SEVIEW 6.2 documentation. Additional parameters were selected based on generic site conditions. Chemical Parameters Modeling was performed for a release of benzene. Values for the organic carbon adsorption coefficient (Koc) and the water diffusion coefficient were obtained from the SEVIEW 6.2 chemical database. The water diffusion coefficient is only used in the AT123D model. Results Results are based on the maximum predicted groundwater concentration at a point located 10 meters (32.8 feet) downgradient of the release. Maximum predicted concentrations for AT123D were determined using the SEVIEW Point of Compliance reports. Determination of the maximum predicted concentrations in BIOSCREEN was not as easy. Multiple model runs were performed until the maximum concentration was observed. A summary of the model results are presented below. According to AT123D it would take benzene 10 years to reach the maximum concentration at a point 10 meters downgradient in sand. BIOSCREEN predicted that it would take 62 years under steady state conditions and about 14 years using the declining source term. Based on AT123D it would take 127 years to reach the maximum groundwater concentration at a point located 10 meters downgradient in the silt aquifer. However, according to BIOSCREEN it would take 850 years at the same location under steady state conditions and about 300 years using the declining source term. For benzene in clay AT123D predicts that it would take 820 years to reach the maximum groundwater concentration at a point located 10 meters downgradient. According to BIOSCREEN benzene would not have even reached that location in 820 years. In fact, BIOSCREEN predicts that it would take 12,000 years to reach the maximum groundwater concentration 10 meters down gradient for steady state conditions and about 4,500 years using the declining source term. Closer agreement between the models in the sand aquifer was achieved using the AT123D load as the BIOSCREEN source term mass. Although, the BIOSCREEN concentrations were still significantly higher contaminant travel times to downgradient locations were almost identical. However, this was not true of the silt and clay aquifers. Discussion Results between the models are most similar for the sandy aquifer. This is most likely because the flow rates are high enough that diffusion has limited influence on overall contaminant transport. This is especially true of contaminant mobility when the AT123D load was used to calibrate the BIOSCREEN declining source term in the sand aquifer. BIOSCREEN also predicted higher concentrations than AT123D for the silt and clay aquifers, and it severely underestimated contaminant mobility. The limited contaminant mobility may be due to the lack of the water diffusion process in BIOSCREEN. However, it could also be due to variations in the methods used to simulate other transport and fate processes. This raises concerns for those who believe that it is not necessary to model such long periods of time. This contradicts the assumption that simplistic models such as BIOSCREEN can be used to accurately predict downgradient contaminant concentrations in all aquifers. Conclusions AT123D consistently predicted lower groundwater concentrations for all aquifer types. This would result in higher risk-based cleanup objectives and a reduction in remedial activities. As AT123D is a more complex model it also provides for greater confidence in the results. Not only does AT123D provide lower results, it can be used over a larger range of contaminant release scenarios. Based on this review the following conclusions were made: • Both models are fairly easy to setup and run. • The SEVIEW Point of Compliance reports made evaluation of the AT123D results much easier. • Contaminant mobility is significantly lower in BIOSCREEN. • Predicted contaminant concentrations are significantly higher in BIOSCREEN. • The experimental declining source term in BIOSCREEN should not be used. • Limited contaminant mobility in BIOSCREEN raises serious concerns; at the very least it should be run until the maximum concentration is obtained. • Under many aquifer types BIOSCREEN is far less conservative than AT123D.
SEVIEW
Transport and fate modeling software


AT123D vs. BIOSCREEN
This is a comparison between the AT123D and BIOSCREEN analytical groundwater models. Rather than simply providing a technical description of the models this review looks at variations in model output for comparable input parameters. Unlike numerical models, results in analytical models are calculated independently at each point. This means that users do not need to design a network of grid nodes prior to modeling. In addition, calibration is significantly easier. This ease of use does not necessarily mean the results are any less accurate. In fact, the results can be just as valid for certain conditions. Obviously, this is not to say that all analytical models are equal. As with numerical models there can be significant differences as to which processes are simulated and how the processes are simulated. Both of these models are available as public domain versions and have been incorporated in integrated software packages.AT123D
AT123D is a three-dimensional analytical groundwater transport and fate model. Processes simulated include: advection, dispersion, diffusion, adsorption, and biological decay. AT123D was developed in FORTRAN by G. T. Yeh (1981) at Oak Ridge National Laboratory. The version of AT123D in SEVIEW was enhanced to simulate 999 years. Contaminant releases can be simulated as instantaneous, continuous, or varying loads. The ability to utilize varying loads allows it to be linked to the SESOIL vadose zone model. Source load configurations can be established as a point, line, plane, or volume release. AT123D has been used by numerous regulatory agencies to establish baseline cleanup objectives. Cleanup objectives for other regulatory agencies or for site-specific conditions can be calculated by varying the input parameters. BIOSCREEN BIOSCREEN is a two-dimensional screening level groundwater transport and fate model. It was developed in 1996 under contract from the US Air Force, by Ground Water Services, Inc. Unlike most other models, BIOSCREEN is not a standalone program in that it requires Microsoft Excel to run. Transport and fate processes simulated include: advection, dispersion, adsorption, and biological decay. The source is defined as a plane perpendicular to groundwater flow. BIOSCREEN is based on the Domenico model which assumes the source concentration remains constant through time. The developers of BIOSCREEN determined this to be overly conservative and added a declining source term. This declining source should not be confused with biodegradation. Instead, the declining source concentration is designed to simulate the flushing of contamination from the source via groundwater flow. This declining source should be used cautiously. Even the BIOSCREEN documentation states: "this is an experimental relationship, and it should be applied with caution." Model Parameters Input parameters were based on the release of benzene in three aquifer types: sand, silt, and clay. A volume of contaminated groundwater was established. This volume was used to define the release coordinates in AT123D. As BIOSCREEN cannot simulate a volume release, the source was simulated as a plane along the x and y axis. However, the volume of the source was used to calculate the total mass used in the BIOSCREEN declining source term. BIOSCREEN modeling was performed using both an infinite release and a declining source term. A concentration of 1.0 mg/L was established in both models. Mass load to AT123D was calibrated to achieve an initial concentration of 1.0 mg/L in the volume of contaminated groundwater. Additional BIOSCREEN runs were performed using the AT123D mass load for the declining source term. Aquifer Parameters Aquifer parameters were based on three soil types: sand, silt, and clay. Parameters for these soil types were based on information provided in the SEVIEW 6.2 documentation. Additional parameters were selected based on generic site conditions. Chemical Parameters Modeling was performed for a release of benzene. Values for the organic carbon adsorption coefficient (Koc) and the water diffusion coefficient were obtained from the SEVIEW 6.2 chemical database. The water diffusion coefficient is only used in the AT123D model. Results Results are based on the maximum predicted groundwater concentration at a point located 10 meters (32.8 feet) downgradient of the release. Maximum predicted concentrations for AT123D were determined using the SEVIEW Point of Compliance reports. Determination of the maximum predicted concentrations in BIOSCREEN was not as easy. Multiple model runs were performed until the maximum concentration was observed. A summary of the model results are presented below. According to AT123D it would take benzene 10 years to reach the maximum concentration at a point 10 meters downgradient in sand. BIOSCREEN predicted that it would take 62 years under steady state conditions and about 14 years using the declining source term. Based on AT123D it would take 127 years to reach the maximum groundwater concentration at a point located 10 meters downgradient in the silt aquifer. However, according to BIOSCREEN it would take 850 years at the same location under steady state conditions and about 300 years using the declining source term. For benzene in clay AT123D predicts that it would take 820 years to reach the maximum groundwater concentration at a point located 10 meters downgradient. According to BIOSCREEN benzene would not have even reached that location in 820 years. In fact, BIOSCREEN predicts that it would take 12,000 years to reach the maximum groundwater concentration 10 meters down gradient for steady state conditions and about 4,500 years using the declining source term. Closer agreement between the models in the sand aquifer was achieved using the AT123D load as the BIOSCREEN source term mass. Although, the BIOSCREEN concentrations were still significantly higher contaminant travel times to downgradient locations were almost identical. However, this was not true of the silt and clay aquifers. Discussion Results between the models are most similar for the sandy aquifer. This is most likely because the flow rates are high enough that diffusion has limited influence on overall contaminant transport. This is especially true of contaminant mobility when the AT123D load was used to calibrate the BIOSCREEN declining source term in the sand aquifer. BIOSCREEN also predicted higher concentrations than AT123D for the silt and clay aquifers, and it severely underestimated contaminant mobility. The limited contaminant mobility may be due to the lack of the water diffusion process in BIOSCREEN. However, it could also be due to variations in the methods used to simulate other transport and fate processes. This raises concerns for those who believe that it is not necessary to model such long periods of time. This contradicts the assumption that simplistic models such as BIOSCREEN can be used to accurately predict downgradient contaminant concentrations in all aquifers. Conclusions AT123D consistently predicted lower groundwater concentrations for all aquifer types. This would result in higher risk-based cleanup objectives and a reduction in remedial activities. As AT123D is a more complex model it also provides for greater confidence in the results. Not only does AT123D provide lower results, it can be used over a larger range of contaminant release scenarios. Based on this review the following conclusions were made: • Both models are fairly easy to setup and run. • The SEVIEW Point of Compliance reports made evaluation of the AT123D results much easier. • Contaminant mobility is significantly lower in BIOSCREEN. • Predicted contaminant concentrations are significantly higher in BIOSCREEN. • The experimental declining source term in BIOSCREEN should not be used. • Limited contaminant mobility in BIOSCREEN raises serious concerns; at the very least it should be run until the maximum concentration is obtained. • Under many aquifer types BIOSCREEN is far less conservative than AT123D.
SEVIEW
Transport and fate modeling software