Copyright © 2023 ESCI, LLC - All Rights Reserved.
Multiple Source Version of AT123D
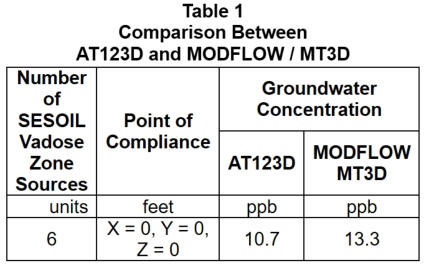
SEVIEW can now simulate multiple contaminant sources. This includes any combination of SESOIL vadose zone releases and AT123D groundwater plumes. Until now this capability only existed in advanced numerical models. Each source is modeled separately allowing for individual sources to be toggled on and off in the post processor. This feature allows for evaluation of multiple release scenarios without the necessity of rerunning the models. This means you can evaluate the impact of various remedial options on the fly. Making it easy to determine the impact of individual sources. Results can then be used to establish which areas to cleanup and to what concentration. The post processor approach helped with validation process as individual runs could quickly be validated with the original version of AT123D. Uses of the Multiple Sources The multiple sources can be used to establish groundwater concentrations associated with non-contiguous “patchy” sources. It can also be used to establish separate groundwater impacts associated with SESOIL releases at specific depths. Finally, it could be used to establish groundwater concentrations associated with multiple groundwater plumes. MODFLOW / MT3D Type Results in Seconds The multiple source version of AT123D was developed for the U.S. Army Corps of Engineers. As part of the quality control process they conducted a comparison between the multiple SESOIL sources linked to AT123D and MODFLOW / MT3D. They concluded that AT123D and MODFLOW / MT3D produced nearly identical results (Table 1) and in a fraction of the time. Superposition As with all other groundwater models MT3D simultaneously simulates all sources at once. As such it is impossible to determine the influence of individual sources without running the model again, which could be very time consuming. AT123D simulates each source separately. Individual results are combined using superposition in the SEVIEW post processor. This means contaminant sources to be switched off and on, providing for an instantaneous evaluation of impact from individual sources. SEVIEW uses superposition to combine select AT123D results. Superposition consists of adding groundwater concentrations produced by each of the sources. AT123D Reports Analytical groundwater models produce results at specific points. However, these results are compared with measurements obtained from groundwater monitoring wells and piezometers. Groundwater mixing within each well reduces the field measurement. Numerical models account for this by producing results at observation wells. Thus, providing an apples to apples comparison between the model results and real world measurements. This capability was added to the SEVIEW version of AT123D. A screened interval can now be individually assigned to AT123D POC. This allows for the simulation of both monitoring wells and piezometers. A pie chart presents the percentage of the mass contribution from each source. This feature is especially useful in determining the percentage of contaminant mass contributed by on-site versus off-site sources.
SEVIEW
Transport and fate modeling software


Multiple Source Version
of AT123D
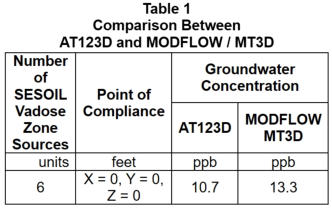
SEVIEW can now simulate multiple contaminant sources. This includes any combination of SESOIL vadose zone releases and AT123D groundwater plumes. Until now this capability only existed in advanced numerical models. Each source is modeled separately allowing for individual sources to be toggled on and off in the post processor. This feature allows for evaluation of multiple release scenarios without the necessity of rerunning the models. This means you can evaluate the impact of various remedial options on the fly. Making it easy to determine the impact of individual sources. Results can then be used to establish which areas to cleanup and to what concentration. The post processor approach helped with validation process as individual runs could quickly be validated with the original version of AT123D. Uses of the Multiple Sources The multiple sources can be used to establish groundwater concentrations associated with non- contiguous “patchy” sources. It can also be used to establish separate groundwater impacts associated with SESOIL releases at specific depths. Finally, it could be used to establish groundwater concentrations associated with multiple groundwater plumes. MODFLOW / MT3D Type Results in Seconds The multiple source version of AT123D was developed for the U.S. Army Corps of Engineers. As part of the quality control process they conducted a comparison between the multiple SESOIL sources linked to AT123D and MODFLOW / MT3D. They concluded that AT123D and MODFLOW / MT3D produced nearly identical results (Table 1) and in a fraction of the time. Superposition As with all other groundwater models MT3D simultaneously simulates all sources at once. As such it is impossible to determine the influence of individual sources without running the model again, which could be very time consuming. AT123D simulates each source separately. Individual results are combined using superposition in the SEVIEW post processor. This means contaminant sources to be switched off and on, providing for an instantaneous evaluation of impact from individual sources. SEVIEW uses superposition to combine select AT123D results. Superposition consists of adding groundwater concentrations produced by each of the sources. AT123D Reports Analytical groundwater models produce results at specific points. However, these results are compared with measurements obtained from groundwater monitoring wells and piezometers. Groundwater mixing within each well reduces the field measurement. Numerical models account for this by producing results at observation wells. Thus, providing an apples to apples comparison between the model results and real world measurements. This capability was added to the SEVIEW version of AT123D. A screened interval can now be individually assigned to AT123D POC. This allows for the simulation of both monitoring wells and piezometers. A pie chart presents the percentage of the mass contribution from each source. This feature is especially useful in determining the percentage of contaminant mass contributed by on-site versus off-site sources.
SEVIEW
Transport and fate modeling software