SESOIL and the Pinios River
Last time we looked at SESOIL and the Nile River.
We now turn our attention to a water balance study of the Pinios River Basin in Greece.
Marc Bonazountas et al. selected to use the SESOIL model1.
As co-developer of SESOIL, Marc knew the hydrologic cycle sub-model was well suited for this purpose.
The principle goal of their evaluation was to determine if SESOIL, with its limited data requirements, could produce reasonable model results.
The Pinios River Basin has a total length of about 210 km, with a surface area of about 9,500 km2, about the size of Delaware and Rhode Island combined.
Elevations range from a high of over 2000 meters in the Pindos Mountains to sea level.
Precipitation varies across the basin, from 50 90 cm/year in the lowlands to 180 cm/year in the mountains.
Most of the precipitation falls from October to April.
The Pinios River discharges 2.56E+9 m3/year to the Aegean Sea.
Annual consumption by municipal, agricultural, and industrial purposes is 7.00E+8 m3/year.
Water demands exceed supply from May until September.
SESOIL Climatic Parameters
The SESOIL hydrologic cycle sub-model uses monthly values for temperature, precipitation, humidity, cloud cover, and surface albedo.
From this data, SESOIL produces monthly surface water runoff, infiltration at the soil surface, evapotranspiration, and groundwater recharge.
It is the monthly groundwater recharge rate that is typically used to predict contaminant migration through the soil column.
The mean annual temperature for the basin is 12.4°C.
Temperatures range from a low of 5°C in January to a high of about 24°C in July and August (Figure 1).
Summers are typically hot and dry with temperatures reaching 40°C.
A latitude of 39.5°N was used for the study area.
For the most part precipitation varies from about 8 12 cm/month from October to April.
November is the driest month during the rainy season with just over 6 cm of monthly precipitation.
Precipitation during May, June, and September drops to about 3 5 cm/month.
Precipitation drops further in July and August to less than 0.7 cm/month (Figure 2).
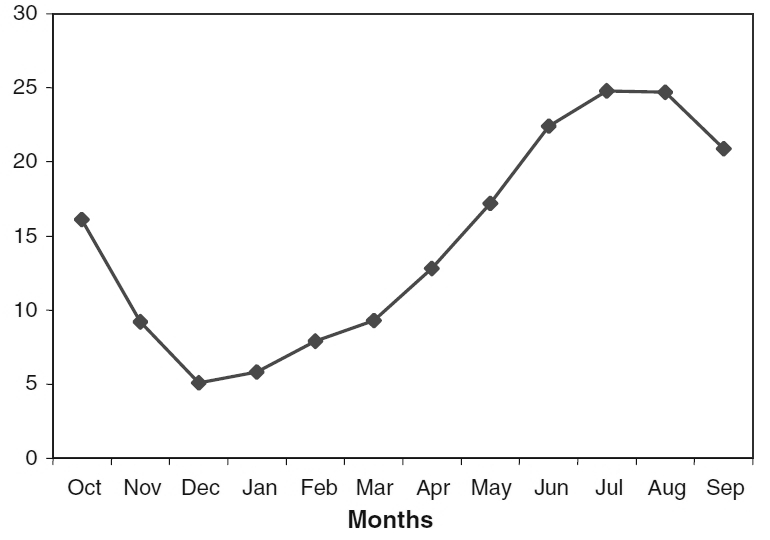
Figure 1. Monthly Temperature
|
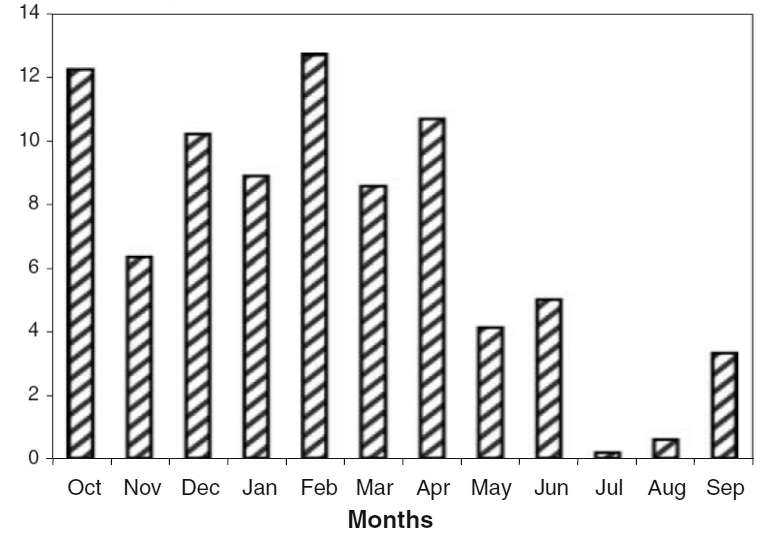
Figure 2. Monthly Precipitation
|
The number of storms varies from a high of 14 storms per month in October to a low of about 0.35 in July and August.
The number of storm events per month ranges from a high of almost 7 in November to a low of about 0.2 in July (Figure 3).
The length of storm events varied from a high of about 0.65 days during October and November.
The storm length dropped to less than 0.02 days in July (Figure 4).
Monthly shortwave surface albedo values were all set to 0.25, typical of grass and other types of green vegetation.
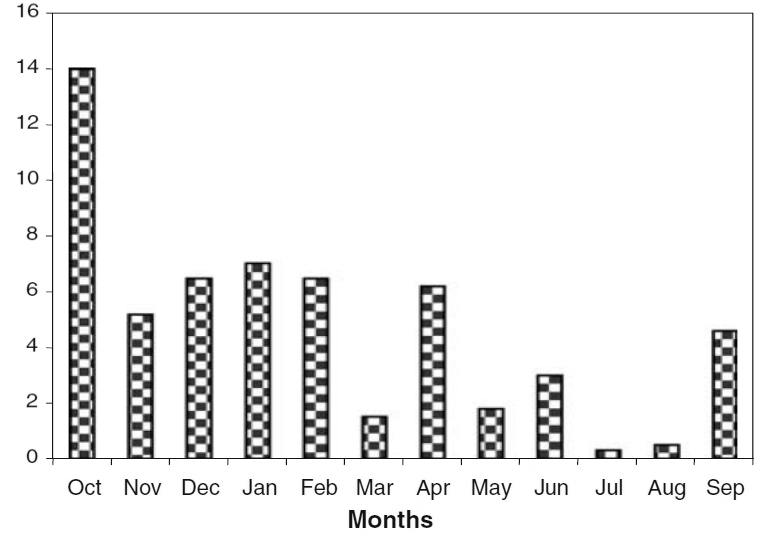
Figure 3. Number of Storms per Month
|
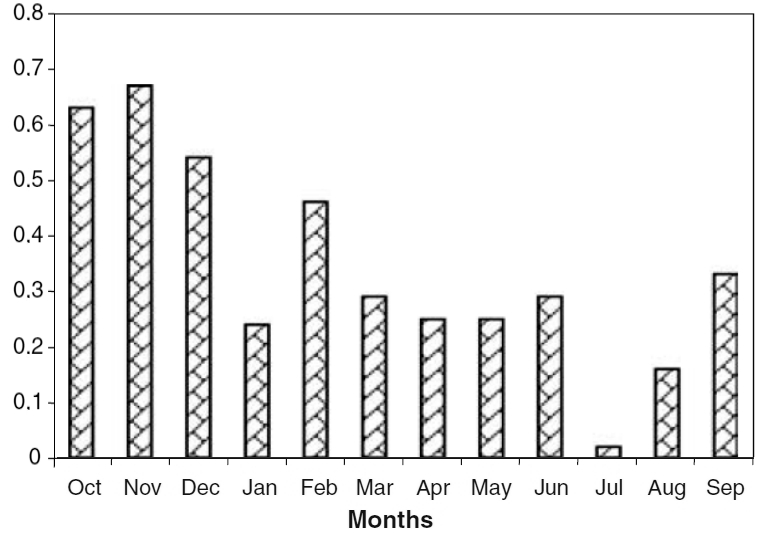
Figure 4. Storm Length in Days
|
Relative humidity varied significantly, from a low of 10% in August, to a high of almost 85% in December (Figure 5).
Monthly cloud cover ranged from a low of about 60% in July to a high of about 90% in February (Figure 5).
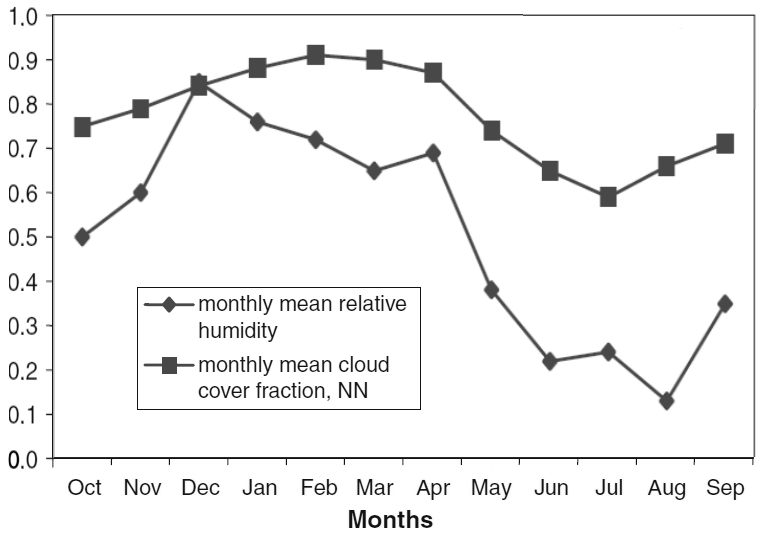
Figure 5. Monthly Relativity Humidity and Cloud Cover
|
SESOIL Soil Parameters
Table 1
SESOIL Parameters
|
Parameter
|
Units
|
Range
|
Selected Value
|
|
Intrinsic Permeability
|
cm2
|
2.0E-10 6.0E-10
|
3.5E-10
|
|
Soil pore disconnectedness index
|
fraction
|
7.0 11.0
|
9.0
|
|
Depth to groundwater
|
cm
|
100 2000
|
100
|
SESOIL Results
For most months there was a close correlation between predicted and measured values of surface water runoff (Figure 6).
At other times, the SESOIL monthly values were somewhat lower.
Probably because modeling did not account for groundwater discharge to the Pinios River.
The discrepancy could also be due to the SESOIL hydrologic cycle sub-model that does not differentiate between precipitation that falls as rain or snow.
Snow accumulating on the surface would reduce groundwater recharge during the winter, come spring the melting snow would increase surface water runoff.
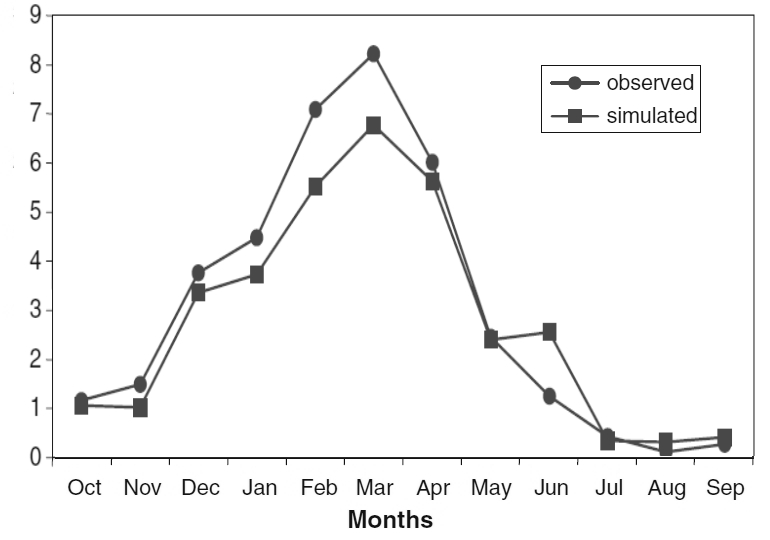
Figure 6. Predicted Surface Water Runoff
|
SESOIL predicts that of the 83.172 cm of annual precipitation, 33.168 cm enters the Pinios River as surface water runoff (Table 2).
The remaining 50 cm/year infiltrate at the top of the soil surface.
About 38 cm/year of water is then returned to the atmosphere as evapotranspiration, producing a groundwater recharge rate of about 12 cm/year.
Table 2
SESOIL Hydrologic Cycle Results
|
Parameter
|
SESOIL Results
(cm)
|
|
Precipitation
|
83.172
|
|
Surface water runoff
|
33.168
|
|
Infiltration
|
50.004
|
|
Evapotranspiration
|
38.028
|
|
Groundwater recharge
|
11.979
|
Rates of evapotranspiration and groundwater recharge are difficult to obtain, so the SESOIL model results could not be compared with known values.
Bonazountas et al. state, The comparison between the observed and the simulated values indicate that the SESOIL model delivered adequate predictions of surface runoff and thus a degree of confidence in the estimated groundwater runoff [recharge] and evapotranspiration.
They go on to say that SESOIL water balance modeling, can be applied in regions without extensive data.
They conclude that SESOIL is a useful water balance model, especially for river basins with insufficient data required by other models.
References
1. M. Bonazountas, D. Panagoulia, N. Passas, K. Syrios, A. Grammatikogiannis, 2005, Water balance estimation via SESOIL:
Pinios River Basin, Greece, Bull Eng Geol Environ (2005) 64: 111116 DOI: 10.1007/s10064-004-0264-3
|
|
|