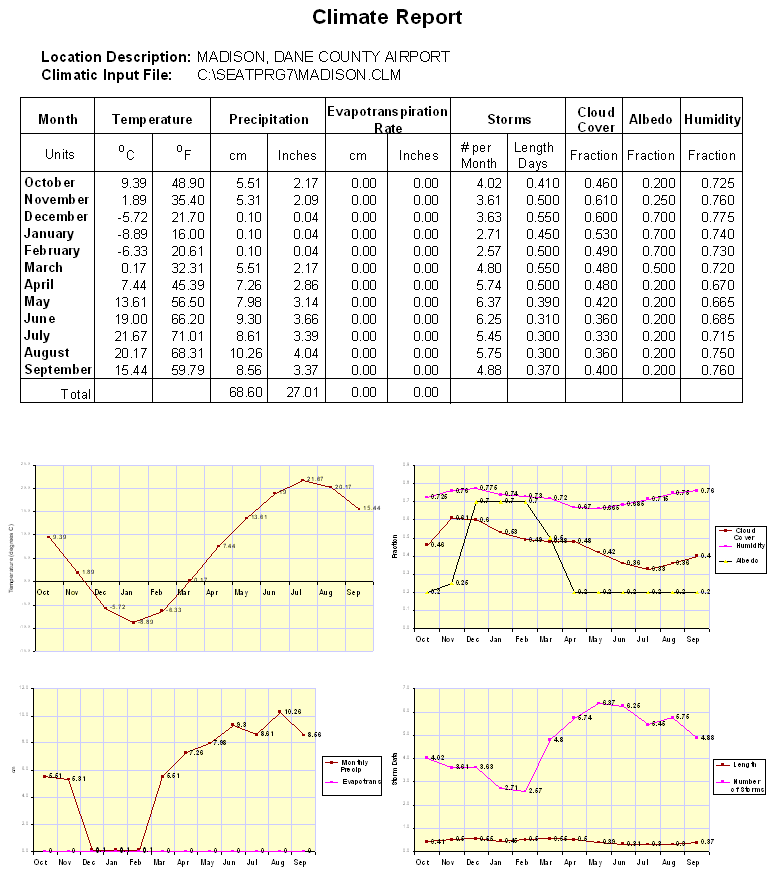
The SESOIL climate report displays the raw climatic input parameters.
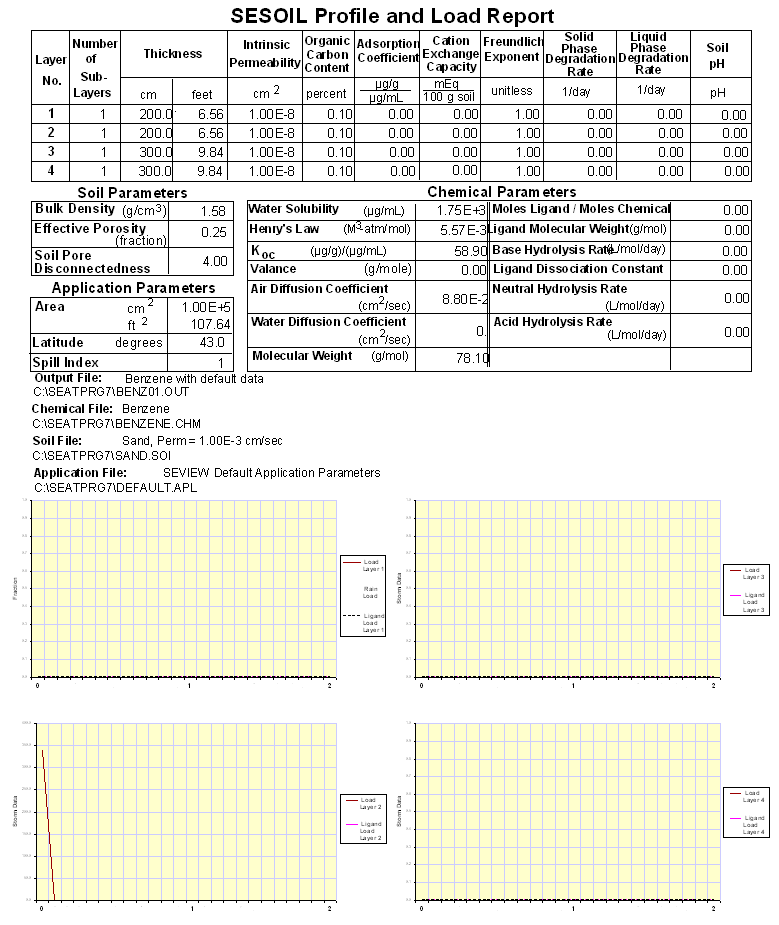
The SESOIL Profile and Load Report displays information on the soil profile and contaminant load.
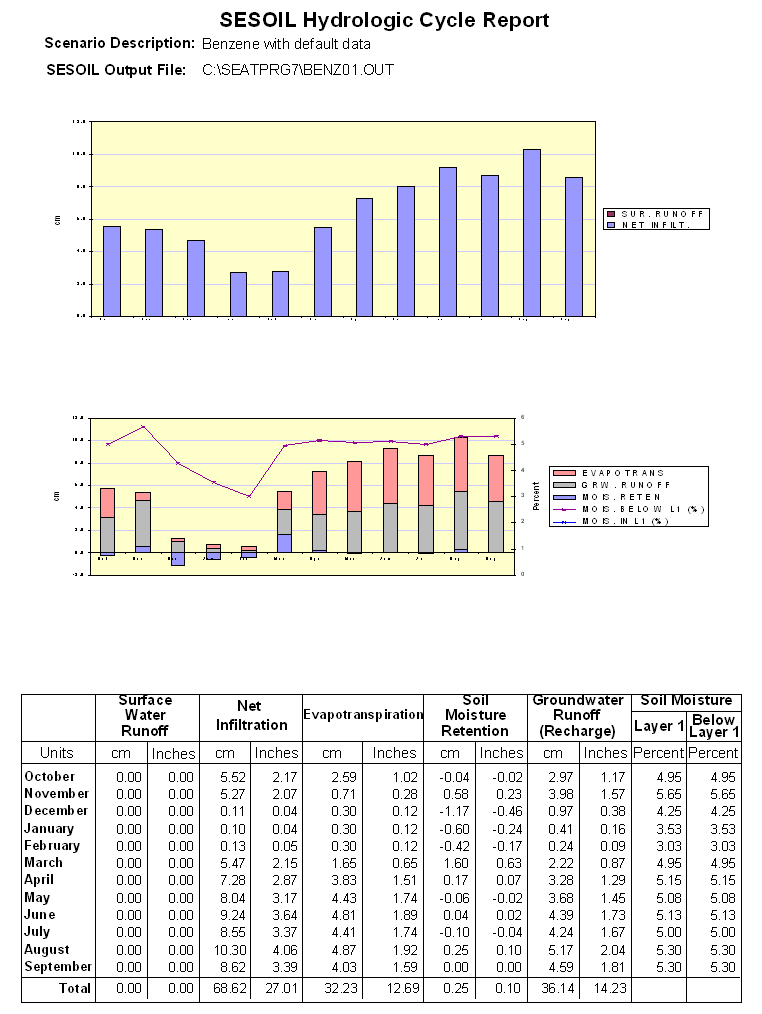
The SESOIL Hydrologic Cycle Report displays predicted values for surface water runoff, soil infiltration, evapotranspiration, soil moisture retention, and groundwater recharge. It also displays predicted soil moisture content.
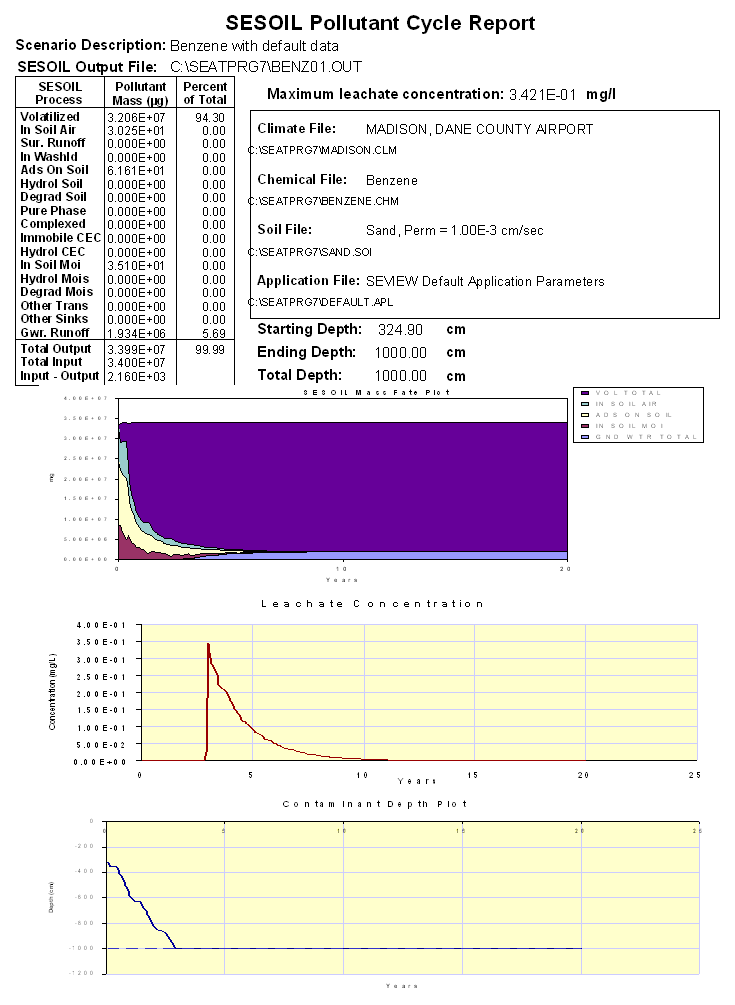
The pollutant cycle report contains several plots and tables that document the results of the SESOIL pollutant fate cycle. The first graph from the top is the mass fate plot. This plot displays the monthly distribution of the contaminant in the SESOIL soil column over time. The leachate concentration plot is located below the mass fate plot. The leachate plot displays the monthly concentration of the contaminant leaving the bottom of the soil column. In addition, the maximum SESOIL leachate concentration value is presented just below the leachate concentration plot. The SESOIL soil column profile is presented next to the leachate plot. The profile displays the thickness of each soil layer in centimeters.
The report also contains a mass balance table. The table displays the mass and percentage of the total input mass in each SESOIL process. The mass balance table is displayed below the leachate plot. A depth of contaminant migration through time plot is presented in the lower right portion of the report. The contaminant starting and ending depths, along with the depth to the water table, are presented above the plot. A description and list of the SESOIL input files is presented above the contaminant depth plot.
Whenever you print or preview a pollutant cycle report, SEVIEW creates a SESOIL summary table. The summary table contains a description of the modeled scenario, the percentage of the mass in each of the SESOIL processes, a contaminant travel time to the water table, the maximum leachate concentration and associated infiltration rate, along with some of the chemical and soil properties used in the scenario. The summary table can be saved in numerous formats including EXCEL and Lotus.
Although the SEVIEW program produces numerous reports, it is impossible to anticipate all potential uses of the model results. SEVIEW provides tools that provide access to all SESOIL and AT123D input and output data. These tools can be used to extract specific data or to present the report data in different ways. Data extracted by SEVIEW can be converted to numerous file formats. This enables the user to plot or evaluate the model results using any spreadsheet and/or data presentation software. In addition the graphs in the SEVIEW reports can be copied and pasted in to numerous programs including Microsoft Word and EXCEL.